Perpetuum has developed a web application for receiving and processing data from the Geolux system that measures the flow of the Sava River under the Hendrix bridge in Zagreb.
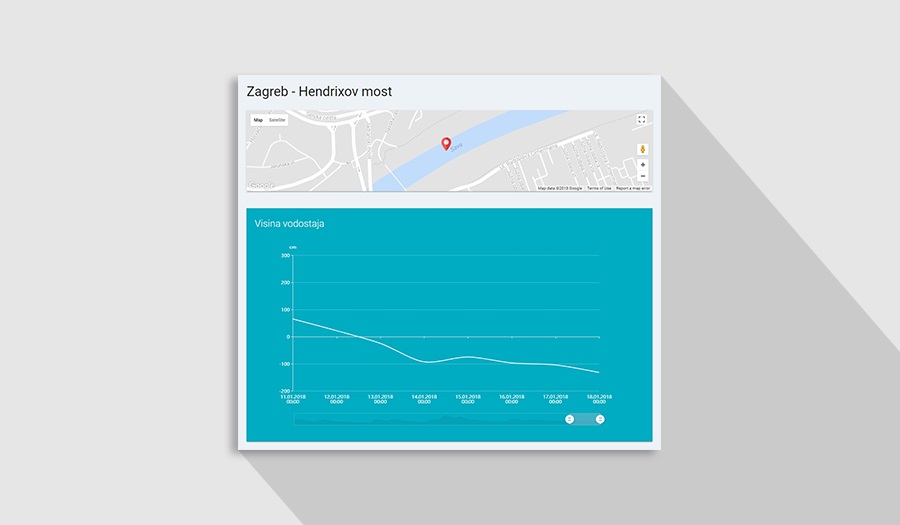
Implement a responsive web application that enables graphical display of data derived from readings of the water level and surface flow of the Sava River. Hydrological data obtained by measurement are used for the purpose of protecting Zagreb and the downstream area from possible floods.
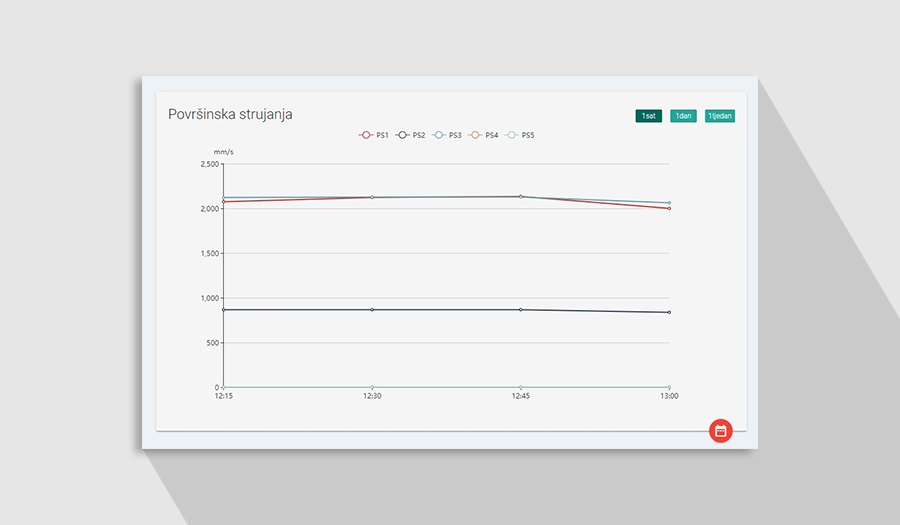
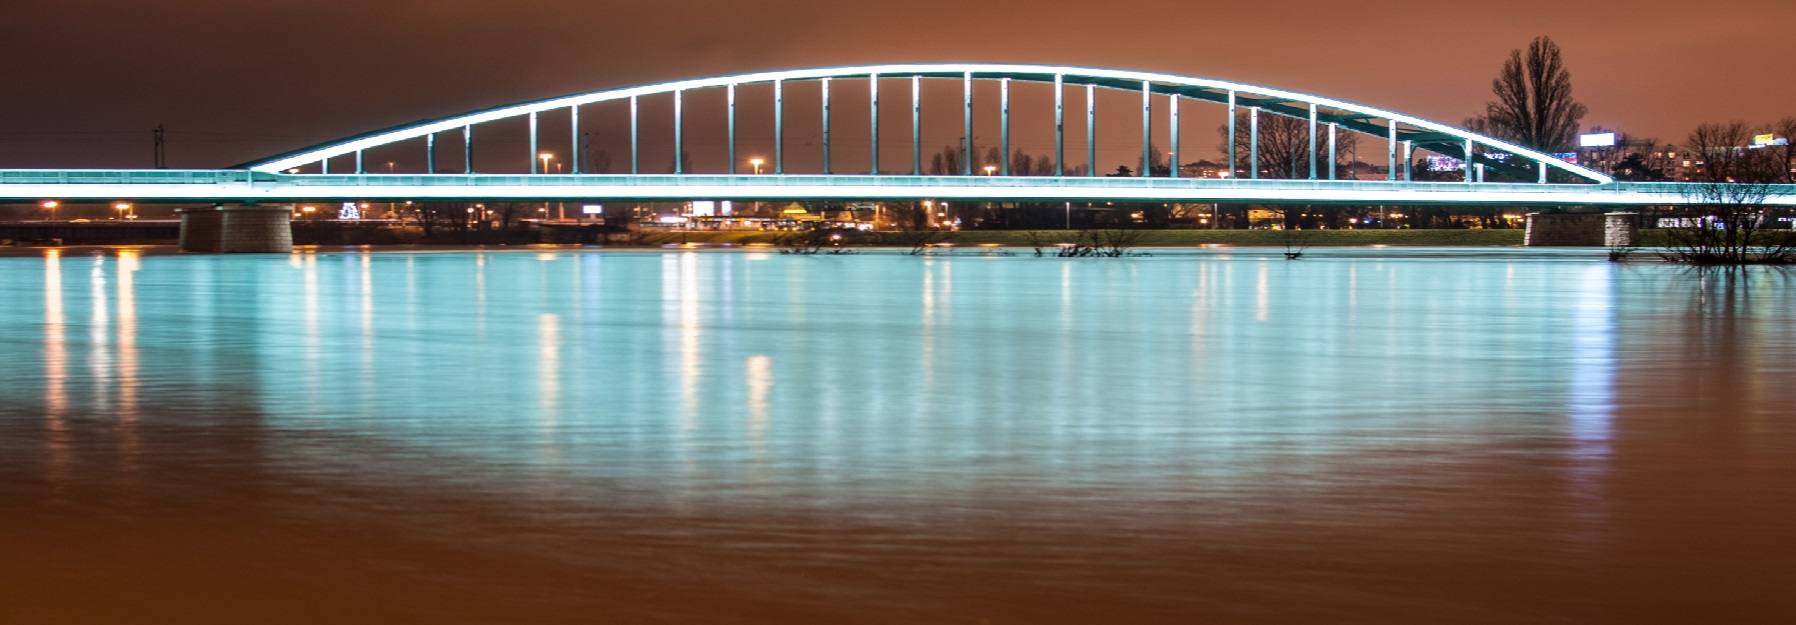
As part of the new Sava flow measurement project in Zagreb, Perpetuum developed and implemented a web application for receiving and processing data from the Geolux system. Geolux, a Croatian company based in Zagreb specializing in high tech radar systems, implemented an innovative hydrological station on the Zagreb railway bridge over the Sava (known by locals as the "Hendrix" bridge) as part of a pilot project for non-contact monitoring of river flow. The system consists of a water level gauge and five strategically placed radar sensors that measure the surface velocity of the river flow.
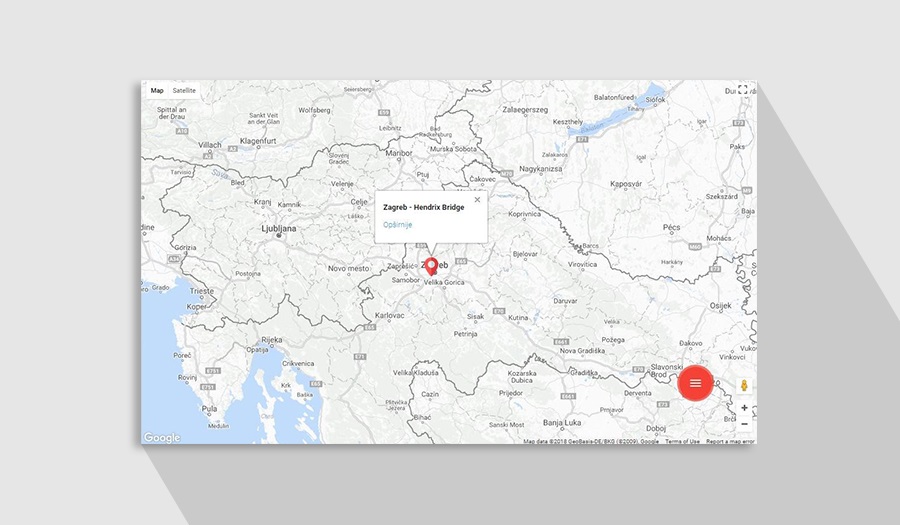
Perpetuum's web application provides a graphical display with various options for viewing, filtering and reading data on water level, flow and other measured data. In addition to the measured data, information about the measurement location is also displayed. The application is designed in such a way that data can be collected, processed and displayed from other measuring points, i.e. locations. It is based on the Microsoft Azure platform, which enables scalability and flexibility.
The focus of our responsive web application is on the flexible graphics display. Since it was a pilot project where it was necessary to quickly deliver a functional demo, we used the Lumen Micro-Framework in PHP for the backend. We were thus able to do rapid development (because the framework is based on the well-known Laravel framework), as well as build a fast application due to the specificity of the framework, which is focused on the development of microservices and APIs.
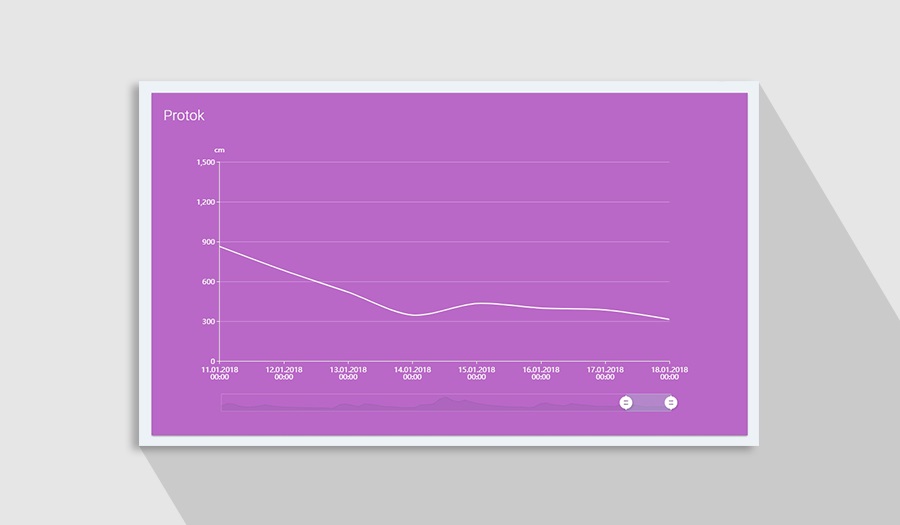
When choosing a library for displaying graphs, we decided on eCharts. It is an open-source library that offers great flexibility and display quality on desktop devices, but also - the most important thing for the project - display and interactivity on mobile devices. Although it is a Chinese library of the Baidu development team, its documentation is very well written for English-speaking countries.